India runs one of the largest public-finance machines on earth in the open. Every year, more than forty lakh crore rupees of government expenditure, over twenty lakh crore in tax revenue, and the balance sheets of twenty-six public sector banks managing upward of a hundred lakh crore in deposits are documented, structured, and published on a single national portal. That portal is data.gov.in — the Open Government Data (OGD) Platform India, operated by the National Informatics Centre under the Ministry of Electronics & Information Technology.
For analysts, fintech founders, and data teams, this is an underused asset. The platform hosts 50+ high-traffic financial datasets spanning budgets, public financial management, direct benefit transfers, tax collections, banking health, and subsidy schemes — most of them free, many of them API-accessible, and a good number refreshed monthly. The challenge is rarely availability. It is navigation: knowing which ministry publishes what, at what granularity, how often, and how to wire it into a pipeline that does not break the next time a department renames a resource.
This piece maps the landscape end to end. A companion analysis ranks the single highest-value datasets to start with; here, the goal is the bigger picture — how the ecosystem is organized and where the analytical leverage actually sits.
The Shape of the Ecosystem
The financial data on data.gov.in clusters into a handful of recognizable themes. Rather than a flat list, it helps to see them as families of datasets, each anchored to a publishing department and a characteristic update rhythm.
The broad families are:
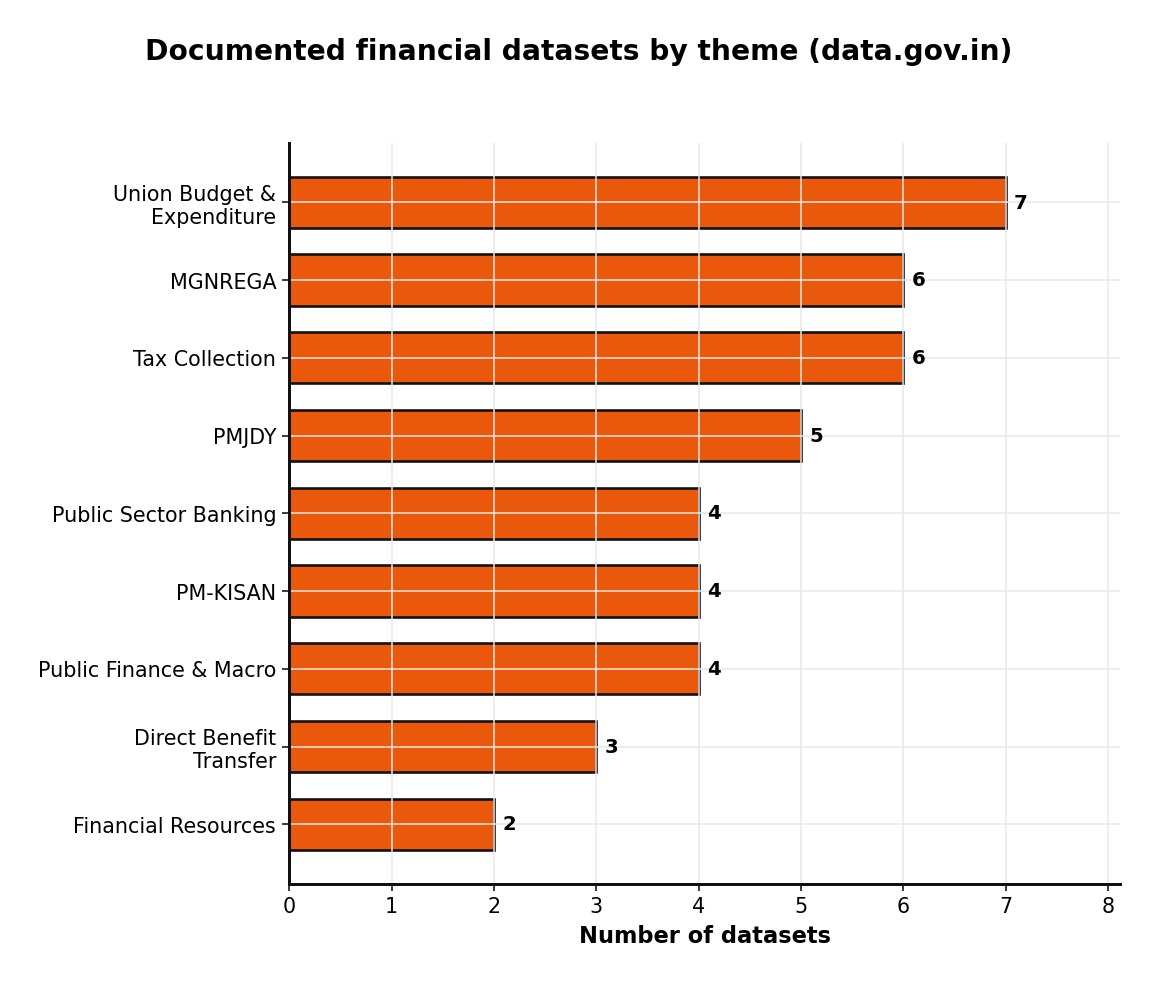
- Union Budget & Government Expenditure — the deepest catalog. Annual budgets, economic classification of the central budget, total central expenditure, head-of-account-wise spending, centrally sponsored schemes, and state/UT-wise allocation, release and utilisation data.
- Direct Benefit Transfer (DBT) — scheme-wise disbursement and beneficiary status, including Aadhaar linkage and bank-account coverage, tracked month by month.
- Flagship welfare schemes — PM-KISAN (farmer income support), PMJDY (financial inclusion accounts), and MGNREGA (rural employment wages). These carry the heaviest traffic because they update frequently and touch hundreds of millions of people.
- Tax Collection — corporate tax, GST, customs and union excise duty, service tax, and GST enforcement metrics, several refreshed monthly.
- Public Sector Banking — key financial ratios for 26 PSBs, state and district banking statistics, priority sector lending, and gross NPA trends sourced from RBI.
- Public Finance & Macro — food subsidy releases, per-kilogram rice and wheat subsidy, foreign trade index numbers reaching back to 1949-50, and sources of change in money stock (M3).
Who Publishes What
Understanding ownership matters because it tells you where the authoritative version lives and which department's reporting cadence you are inheriting.
The Ministry of Finance is the dominant publisher, through three arms. The Department of Economic Affairs owns the Union Budget series (2013-14 onward), central expenditure, economic classification, deficit statistics, foreign trade, money stock, and centrally sponsored schemes. The Department of Financial Services owns PMJDY, banking sector statistics, PSB financial data, and priority sector lending. The Department of Expenditure covers budget allocation and execution down to ministry and scheme level.
Beyond Finance, three line ministries carry the high-volume welfare data:
- Ministry of Agriculture & Farmers Welfare — PM-KISAN beneficiary and payment data, down to village and gender granularity.
- Ministry of Rural Development — MGNREGA employment, wage rates, funds released, and pending wage and material liabilities.
- Ministry of Food & Public Distribution — food subsidy releases and PDS cost data under the National Food Security Act.
This division of labor is the single most useful mental model for working with the portal. When a resource moves or a schema shifts, the owning department — not the platform — is the source of truth.
Scale: Why This Data Matters
The reason these datasets dominate traffic is sheer reach. The flagship schemes operate at a scale that few private datasets in India can match.
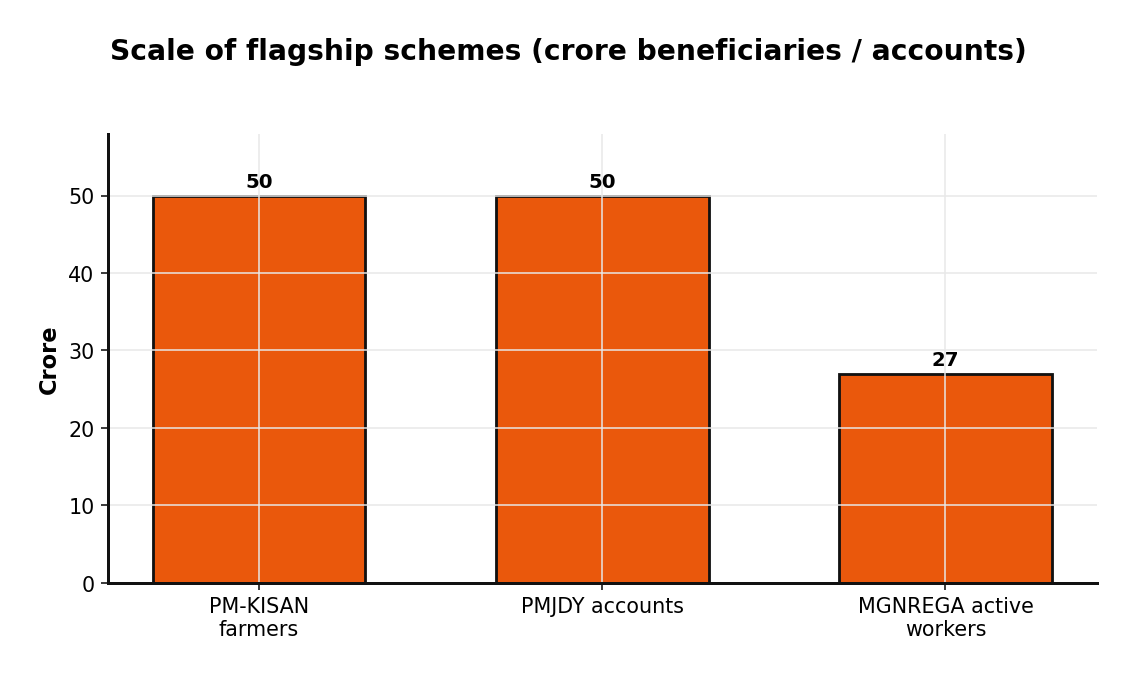
PM-KISAN channels income support to roughly fifty crore farmer touchpoints across its installments; PMJDY has opened over fifty crore bank accounts as a financial-inclusion backbone; and MGNREGA sustains more than twenty-seven crore active worker accounts. Layer on the macro flows — budget allocations spread across 28+ ministries, and revenue collected across multiple tax types — and the portal becomes a near-complete ledger of how public money enters, moves through, and exits the Indian economy.
That scale translates directly into financial magnitude.
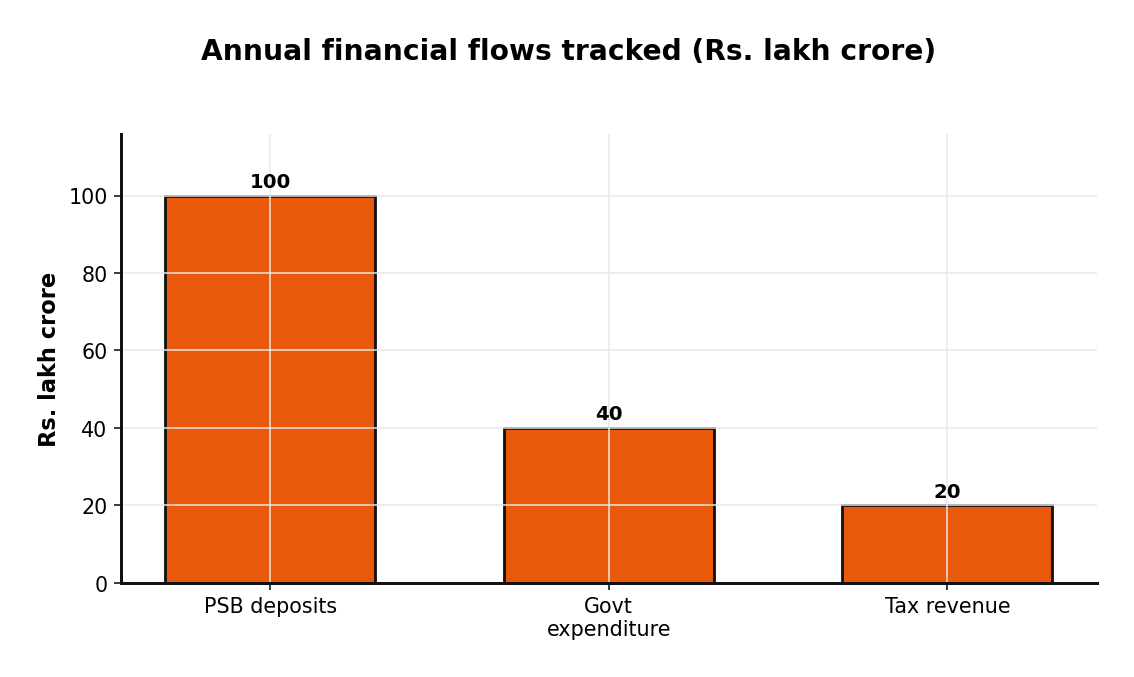
These are not abstract figures. They are the denominators against which any fintech, lending, agri-tech, or policy-analytics product in India is ultimately measured — and they are sitting in the open.
Access: APIs, Formats, and Granularity
The platform is built for programmatic consumption, not just manual download. Many datasets expose a REST API through api.data.gov.in/v1, documented under the OpenAPI specification, with a per-user API key generated on the individual dataset page. Confirmed API-accessible families include state/UT budget and expenditure, Union Budget series, GST and tax collections, MGNREGA, PM-KISAN, and banking statistics.
Where an API is not exposed, data is still retrievable in CSV, Excel, JSON, XML, RDF, and PDF. For pipeline work, the practical hierarchy is clear: prefer the API where it exists, fall back to CSV or JSON for scheduled scraping, and treat PDF-only resources as a last resort requiring extraction.
Granularity is a genuine strength. The same scheme is frequently published at multiple levels — national (all-India), state/UT, district, and in PM-KISAN's case even village and gender. Temporally, the data spans monthly, quarterly, and annual cadences. This multi-resolution structure is what makes the portal valuable for analytics: you can build a national trend line and then drill to a single district without leaving the source.
Update Cadence and Data Quality
Freshness varies sharply by category, and knowing the lag is essential to setting honest expectations in any dashboard.
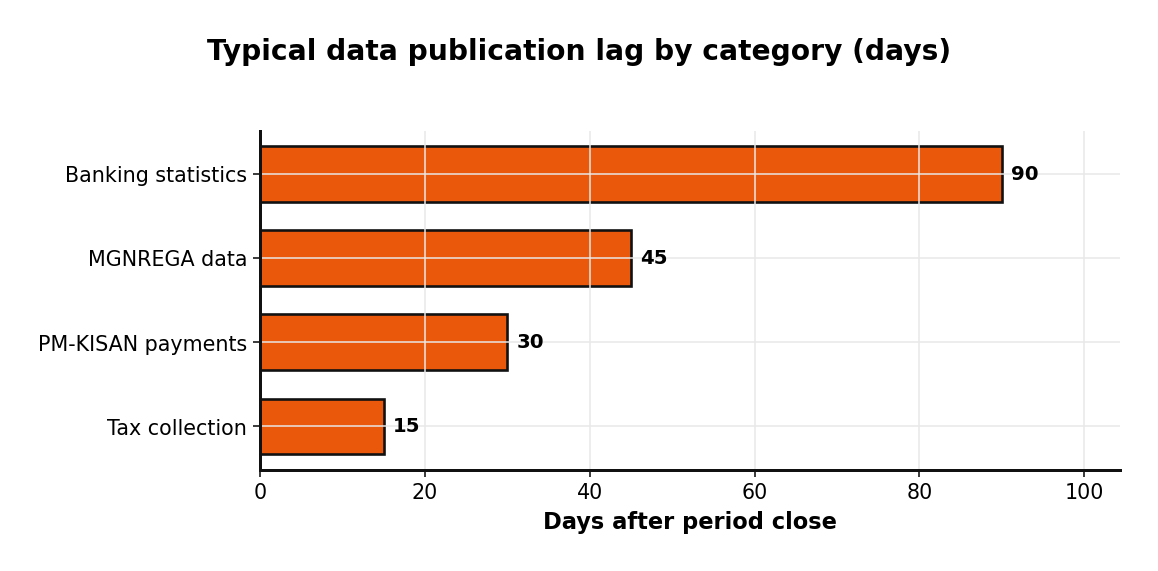
As a rule of thumb: tax collections land within roughly fifteen days of period close, PM-KISAN payment data within about thirty days, MGNREGA figures within forty-five days of month-end, and banking statistics on a quarterly rhythm with up to ninety-day lag. The Union Budget, naturally, is an annual release.
On quality, the strengths are real. The data is official, sourced from the authoritative department or from RBI in the banking case; it carries time-series depth (trade data extends to 1949-50, and most schemes offer five-plus years of history); and it is granular and regularly refreshed. The honest caveats matter too. Resources occasionally migrate across state subdomains — the same MGNREGA or tax dataset may surface under a Punjab, J&K, or other state portal path. File sizes and naming conventions are inconsistent. And the portal is a publication layer, not a real-time feed — for live banking and monetary detail, the RBI Database (DBIE) remains the deeper well, while indiabudget.gov.in and dbtbharat.gov.in offer richer narrative context for budget and DBT respectively.
For a data team, the implication is straightforward: build for schema drift. Validate on ingest, pin to dataset identifiers rather than display names, and reconcile against the owning department's published totals.
From Datasets to Decisions
The analytical applications write themselves once the landscape is clear. A few patterns recur:
- Fiscal monitoring dashboards that track budget allocation versus actual utilisation by state, ministry, or scheme — turning the expenditure catalog into a live execution scoreboard.
- Subsidy and DBT leakage analysis combining beneficiary counts, Aadhaar linkage, and payment-success rates to flag where disbursement is lagging enrolment.
- Regional financial-inclusion mapping that overlays PMJDY account penetration, inoperative-account balances, and district banking statistics to surface underbanked geographies — directly actionable for lending and fintech expansion.
- Tax-revenue trend models using the monthly GST, corporate, and indirect-tax series to nowcast collections and detect compliance shifts.
- Banking-sector health screens built on PSB ratios — ROA, CRAR, NPA, cost-to-income — for credit-risk and counterparty assessment.
- Agri-economy intelligence joining PM-KISAN installment data with food-subsidy and wage-rate series to read rural cash flow.
Each of these is a product, not a report. The raw material is public; the value is in the pipeline, the reconciliation logic, and the interface that turns a thousand CSV rows into a decision.
Closing
India's open financial data is unusually rich, but it rewards engineering. The datasets are scattered across ministries, inconsistent in format, variable in cadence, and prone to quiet schema changes — which is precisely why a clean, monitored pipeline is worth building rather than improvising. At DatCrazy, this is the work we do for clients: ingesting data.gov.in sources through their APIs, normalizing them against the owning department's definitions, and surfacing them as dashboards, alerting systems, and custom analytics that stay current as the underlying resources shift. If your team is trying to turn India's public financial data into something operational, we are happy to help you scope it.