India's open data portal, data.gov.in, is one of the most underused goldmines in the country's tech ecosystem. It quietly tracks where lakhs of crores of public money flow every month: farmer transfers, tax receipts, bank balances, rural wages, food subsidies. For a builder, that is raw material for dashboards, forecasting models, credit-scoring features, and entire data products, most of it free and a lot of it served over an API.
The catch is that not every dataset is worth your time. Some update once a year; some have no API; some are thin. This is the focused shortlist, a companion to our wider survey of data.gov.in's open financial-data landscape. We ranked the 10 highest-value financial datasets by scale, update frequency, and business-intelligence value, and for each one we cover what it is, the ministry behind it, how often it refreshes, whether an API exists, and most importantly what you could actually build with it.
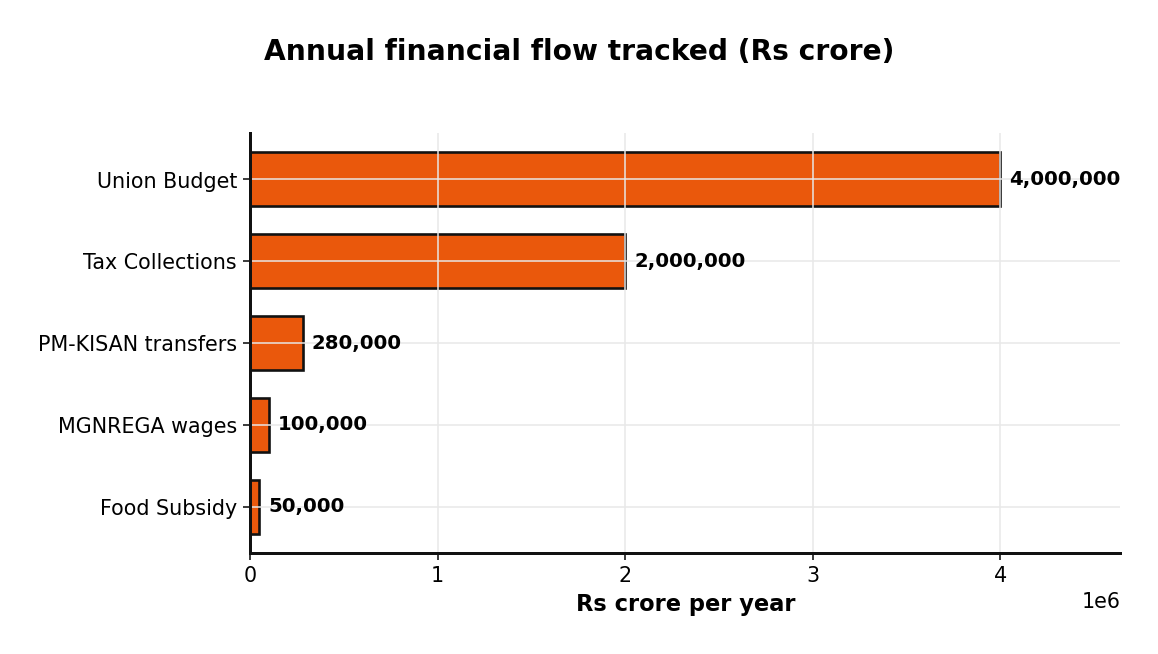
Let's start with the headline numbers. A handful of these datasets track genuinely enormous annual flows.
1. PM-KISAN (Pradhan Mantri Kisan Samman Nidhi)
- What it is: Direct income-support transfers to farmers, the largest direct benefit program in the world.
- Ministry: Agriculture & Farmers Welfare
- Update frequency: Monthly, per installment (15+ installments tracked)
- API available: Yes
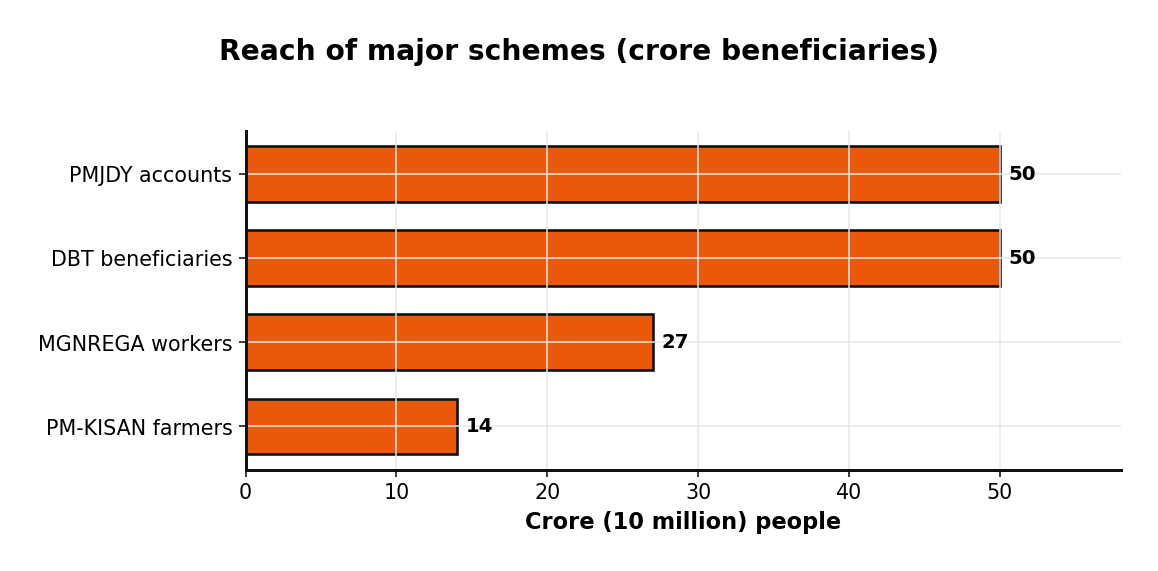
Why it's #1: It reaches 14+ crore (140 million) farmers, moving roughly Rs 2,80,000 crore a year at Rs 20,000 per farmer. Crucially, it is granular down to village, district, and state level, with gender-disaggregated beneficiary counts and installment-wise payment history.
What you could build: Farm-input demand forecasting (fertiliser, seed, equipment), rural income heatmaps, agri-credit risk scoring for lenders sizing up a farmer client base, and government-spend efficiency trackers. If your product touches rural India, this is your anchor dataset.
2. Union Budget & Expenditure Data
- What it is: The most comprehensive picture of government spending, covering 28+ ministries and 1,000+ schemes.
- Ministry: Finance (Department of Economic Affairs)
- Update frequency: Annual, with real-time execution tracking
- API available: Yes
Why it's #2: It accounts for Rs 40+ lakh crore of total expenditure, available in CSV, JSON, XML, and PDF, with a time series stretching back to 1949-50. Sub-components cover economic classification, deficit statistics, centrally sponsored schemes, and state allocations.
What you could build: Sectoral investment maps, fiscal-policy impact dashboards, budget-estimate-vs-actuals trackers, and infrastructure-spend analysis tools for consultancies and policy teams. The depth of the time series makes it ideal for trend modelling.
3. PMJDY (Pradhan Mantri Jan Dhan Yojana)
- What it is: The universal financial-inclusion program, tracking the world's largest bank-account drive.
- Ministry: Finance (Department of Financial Services)
- Update frequency: Monthly
- API available: Yes
Why it's #3: 50+ crore (500 million) accounts opened, Rs 3+ lakh crore in deposits, and 40+ crore RuPay debit cards issued. Datasets break down by state, district, and bank type (PSBs, RRBs, private), plus zero-balance accounts, Aadhaar seeding, and overdraft adoption.
What you could build: Banking-penetration analytics, digital-payment infrastructure scoring, card-industry forecasting, and regional financial-inclusion indices. Fintechs building for next-billion users can use it to size and segment underbanked markets.
4. MGNREGA (Rural Employment Guarantee)
- What it is: Wage-employment data for the rural employment guarantee scheme.
- Ministry: Rural Development
- Update frequency: Monthly (near-monthly updates)
- API available: Yes
Why it's #4: 27+ crore (270 million) active beneficiaries, 200+ crore person-days generated annually, and a Rs 1+ lakh crore wage bill across every rural district. It ships as 8+ distinct datasets covering district employment, skilled/semi-skilled wage rates, asset creation, pending liabilities, and material-vs-wage splits.
What you could build: Rural wage-inflation trackers, off-season employment-pattern models, a real-world unemployment proxy, and state-welfare spending comparisons. Economists and rural-focused lenders get a near-monthly pulse on the rural economy.
5. Tax Collection Datasets
- What it is: Collections across GST, corporate income tax, customs, excise, and service tax.
- Ministry: Finance
- Update frequency: Monthly (roughly 15-day lag)
- API available: Yes (for GST and major taxes)
Why it's #5: Rs 20+ lakh crore in annual revenue, refreshed monthly with minimal lag. Multiple independent datasets allow cross-validation, and GST collections are arguably the best leading economic indicator available in India.
What you could build: Economic-growth nowcasting models, sectoral-health dashboards, business-cycle trackers, and state-wise economic-activity maps. Anyone running a macro or markets product should wire GST data straight into their pipeline.
6. Public Sector Banking Financial Data
- What it is: Detailed financial-health metrics for India's largest public-sector banks.
- Ministry: Finance (Department of Financial Services)
- Update frequency: Quarterly
- API available: Partial
Why it's #6: 26 major PSBs managing Rs 100+ lakh crore in deposits, around 70% of the banking system, with 15+ health indicators per bank, RBI-sourced. You get deposits, advances, ROA, ROE, CRAR, net profit, profit per employee, net NPA ratios, credit-to-deposit, and cost-to-income.
What you could build: Bank-performance benchmarking tools, NPA-trend monitors, credit-risk models, and merger/acquisition evaluation dashboards. The RBI provenance means the data quality is high enough to underpin serious financial analysis.
7. State/UT Budget Allocation & Expenditure
- What it is: Central allocations, releases, and utilisation rates across all states and UTs.
- Ministry: Finance
- Update frequency: Real-time / monthly (quarterly for some schemes)
- API available: Yes
Why it's #7: Coverage of all 28 states and 8 UTs, with opening balances, central and state shares, total available funds, expenditure, and the critical fund-utilisation rate, a key development-efficiency indicator.
What you could build: Fiscal-federalism dashboards, state-spending efficiency leaderboards, regional-development inequality maps, and program-implementation-speed trackers. Policy researchers and CSR teams can pinpoint which states actually deploy the money they receive.
8. Direct Benefit Transfer (DBT) Schemes
- What it is: Cross-scheme transfer data spanning food security, pensions, and subsidies.
- Ministry: Multiple (coordinated by PFMS)
- Update frequency: Monthly
- API available: Yes
Why it's #8: 50+ crore beneficiaries across 8 major departments, with a reliable PFMS backend and real-time tracking. Data includes beneficiary counts, scheme-wise breakdowns, amounts disbursed, payment success/failure status, and Aadhaar linkage.
What you could build: Subsidy-leakage analysis, beneficiary-targeting efficiency tools, payment-system reliability monitors, and poverty-program evaluation dashboards. The success/failure flags are gold for studying where transfer systems break down.
9. Food Subsidy & Public Distribution System
- What it is: Food-subsidy outflows to FCI and state-level PDS metrics.
- Ministry: Food & Consumer Affairs
- Update frequency: Annual / quarterly
- API available: Yes
Why it's #9: Rs 50,000+ crore in annual food subsidy across all PDS states, with per-kg subsidy detail for rice and wheat, decentralized procurement (DCP) reimbursements, and NFSA coverage.
What you could build: Food-policy effectiveness analysis, commodity-cost trackers, food-inflation impact models, and PDS-efficiency evaluations. Agri-commodity and supply-chain players can tie subsidy economics to price movements.
10. Economic & Trade Indicators
- What it is: Long-run export, import, and trade-balance series plus money-stock (M3) data.
- Ministry: Finance (Department of Economic Affairs)
- Update frequency: Annual / regular
- API available: Partial
Why it's #10: The longest continuous economic time series on the portal, running from 1949-50 onwards (75+ years), with exports and imports in both Rs crore and US dollars, trade balance, and trade-index calculations.
What you could build: Long-term growth analysis, trade-policy and import-substitution analysis, currency-movement correlations, and historical macroeconomic research. When you need decades of clean history rather than this month's number, this is the set to reach for.
The pattern across all 10
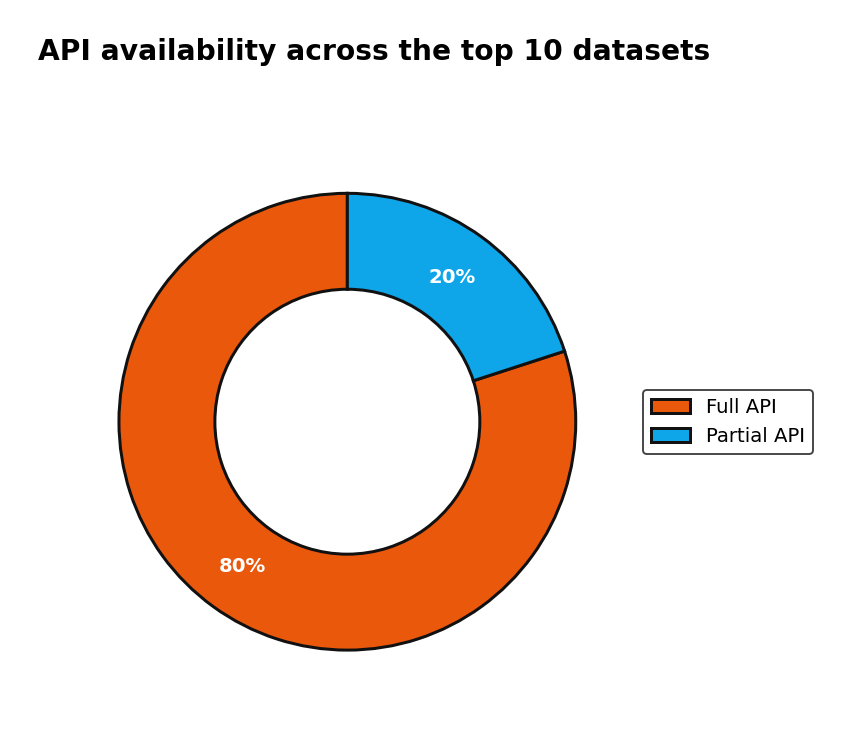
Two things stand out when you line these datasets up. First, API coverage is strong: 8 of the 10 expose a full API, with only banking and trade data limited to partial access.
Second, the reach is staggering. The transfer and inclusion programs alone touch hundreds of millions of people, which is exactly why their data is so valuable for anyone modelling Indian consumers, farmers, or workers.
For the builders: all of the top datasets are served from api.data.gov.in/ using a free API key you register for on the portal. Most refresh monthly or quarterly, so a simple scheduled job keeps your pipeline current, and CSV/JSON formats make ingestion painless. Tax collections (monthly, ~15-day lag) and PM-KISAN installments are the freshest signals; trade and M3 data give you the deepest history.
Turning open data into live products
The gap between a dataset sitting on data.gov.in and a dashboard your team checks every morning is mostly plumbing: authentication, scheduled pulls, schema normalisation, change detection, and a clean front end. That is the work DatCrazy does for clients, wiring these government APIs into reliable pipelines, then surfacing them as live dashboards, internal APIs, or full data products. If one of the datasets above maps to something you want to build, that is a conversation worth having.